I admit that probably 90% of my teaching is traditional lecture. I work problem after problem, carefully explaining each step. So I have a new goal for my classroom in 2016. This year I want to make sure to use at least one “non-lecture” type activity each week.
Here is my list of weekly activities for AP Statistics 2016 🙂
(We use The Practice of Statistics 4e.)
Week One: (Chapter 1)
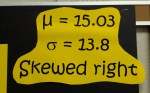
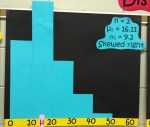
Describing Distributions Small Group Poster Activity
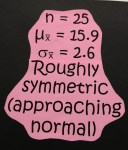
Week Two: (Chapter 2)
Foldables
Empirical Rule Cut Out
Z-scores/Percentiles/Random Variable X Flow Chart
Interpreting and Comparing Percentiles
Week Three: (Review Chapter 2 and Begin Chapter 3)
Normal Probability Cards (similar to “I Have, Who Has”)
Introduction to Correlation Worksheet
Week Four: (Continue Chapter 3)
Interpret Line Features Foldable (slope, y-intercept, r and r-squared)
Guess the Correlation (online java applet)
Week Five: (Review Chapter 3 and Begin Chapter 4)
Reading Computer Output for Regression Foldable
(slope, y-intercept, equation and standard error)
Valentine Data for Foldable, Valentine Graphs Foldable (residuals)
Teenage Mutant Ninja Turtles Breakout for Pizza (Escape Room Techniques)
Week Six: (Continue Chapter 4)
Venn Diagram Vocabulary Activity
Valentine Breakout Review Activity
Week Seven: (Chapter 5)
Kahoot (the winner in each class got a prize)
Week Eight: (Review Chapter 5 and Begin Chapter 6)
Nearpod
Week Nine: (Chapter 6)
Tarsia for Binomial Probabilities
Tarsia – Hermitech Laboratory (program required for Tarsia)


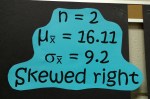
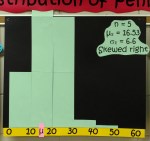
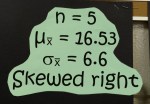
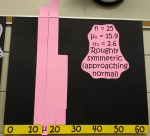
Week 10: (Chapter 7)
Central Limit Theorem Penny Ages


Week 11: (Chapter 8)
St. Patrick’s Breakout


Extending the Penny Ages to Confidence Intervals
Pennies Activity for Confidence Intervals


More to come soon…
If you like this or if you have any suggestions or variations, please comment below. 🙂
Follow me to see more ideas from my classroom.
