 For years my AP Stats students have had difficulty distinguishing between terms as they relate to studies and to experiments.
Stratify vs. Block
Stratify vs. Cluster
Stratify vs. Multistage
Confounding vs. Lurking
Factor vs. Treatment
Non-Response vs. Undercoverage
Non-Response Bias vs. Response Bias
Random Assignment vs. Random Selection
Inference about population vs. Inference about cause & effect
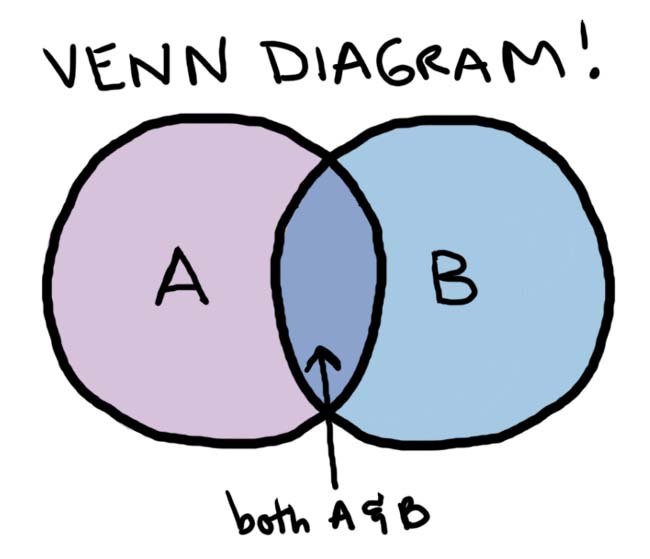
So I came up with an activity that uses a Venn diagram to help students see where how these terms fit together.
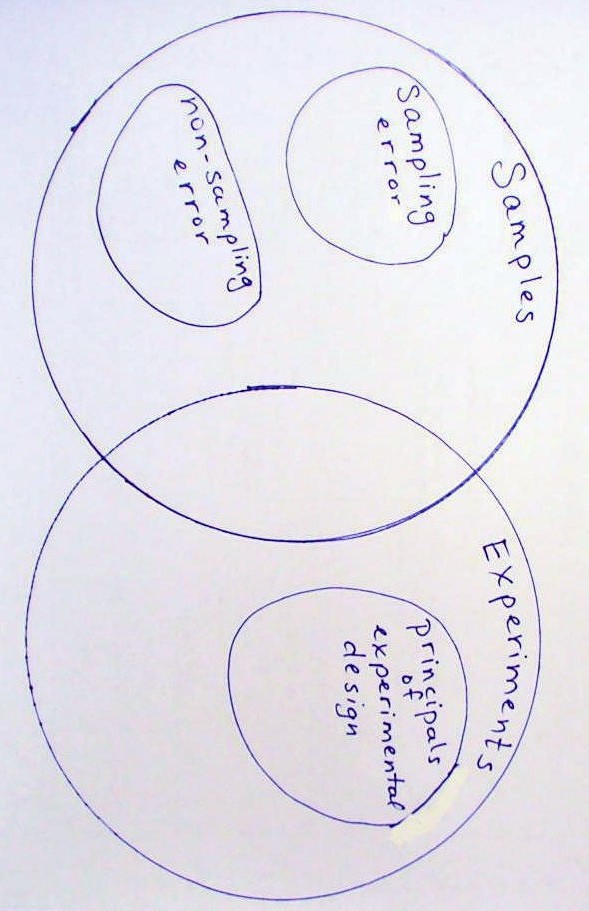
- First, have students draw this Venn diagram on large sticky notes.
The three interior (subset) circles should be drawn in pencil until they see how large they need to be.
- Pass out the vocabulary words for students to cut apart.
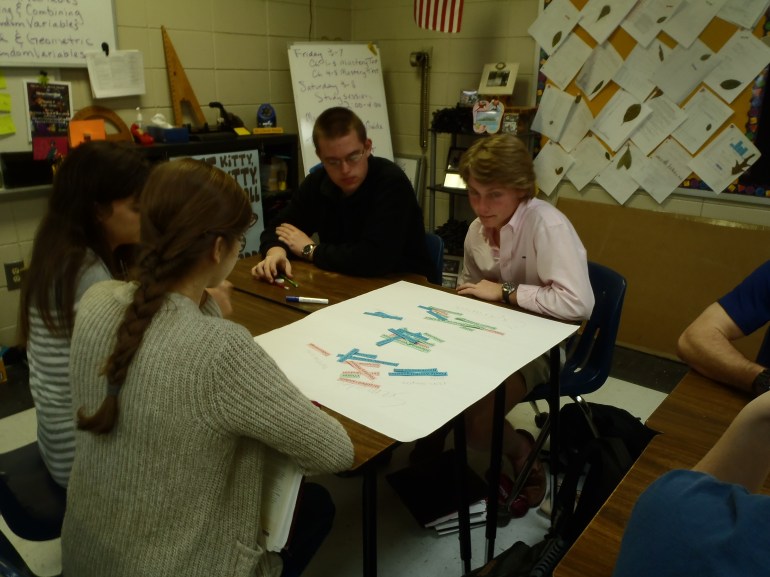
Venn Diagram Vocabulary Activity - Have students work in small groups to place the vocabulary words appropriately in the diagram.
- Here is the final product. Notice that one term (observational study) is in the “universe” but not in either “sample” or “experiment”.

If you like this or if you have any suggestions or variations, please comment below. 🙂
Follow me to see more ideas from my classroom.
